If you're looking for some real-life examples of dashboards, check out the Dashboard Gallery. You'll find dashboards that users from SquaredUp and the Community have created to help you get the most out of SquaredUp DS:
The dashboard is saved as you go along so there's no need to save your changes. You can find your dashboard by clicking on the right-hand menu ☰ > system > unpublished. Draft dashboards are not visible to anyone other than you.
You can toggle between Edit mode and View mode by clicking the edit this dashboard button at the top right.
In SquaredUp DS navigate to where you'd like the dashboard to be created. Hover over the + button and click dashboard. This image shows creating a dashboard at the top level of the navigation bar:
Or you might prefer to navigate to a subfolder and create the new dashboard there:
The most important part of any dashboard is the data. The edit tile (cog) button and configure tile links both allow you to choose the kind of tile you want to add and then configure it.
There are detailed articles for each of the different tiles, that take you through all the configuration options and a walkthrough to get you started.
For more information about how to configure each tile type see the list of tile articles here:
The dashboard is saved as you go along so there's no need to save your changes. You can find your dashboard by clicking on the right-hand menu ☰ > system > unpublished. Draft dashboards are not visible to anyone other than you.
A newly created dashboard will not be visible to others until it is published.
Only admins can publish dashboards, unless you have been given author permissions to a Team Folder see Team Folders
If you made changes to an existing dashboard, the changes will only be visible to others after you published the dashboard again.
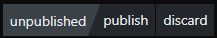
You can identify a dashboard that has not been published yet or has unpublished changes by the unpublished button at the top:
When you click on the unpublished button, you'll have two options:
Publish will make the dashboard or changes visible to others. Note: A newly created dashboard will appear on the menu where you created it. To move the dashboard to a different place on the navigation bar see How to edit the Navigation Bar.
Discard will delete your draft dashboard if it has never been published or, if you made changes to an already published dashboard, discard the changes.
On the main menu your dashboard will be visible to everyone.
If it is within a Team Folder (Enterprise Edition) then it will only be visible to those with access to that Team Folder (see Team Folders).
If the dashboard has Open Access enabled, or is added to the Open Access navigation bar, then it will be visible to anyone, even unlicensed users (see Sharing Dashboards with anyone - Open Access).
Whenever you make a change in edit mode, the Undo button is enabled, clicking this button will undo the last change you made to the dashboard.
Whenever you perform an undo action, the Redo button is enabled, clicking this button will reverse the undo and re-implement the change you last undid.
The following keyboard shortcuts are also supported for this functionality:
The Delete button allows you to delete a perspective quickly.
You can navigate to a dashboard, click the edit button and then click the delete button.
Note about the discard button:
If a dashboard is not published yet (draft), the discard and discard changes buttons will delete it.
If the dashboard has been published, and then you make changes, discard will discard the changes and leave the previously published dashboard live.
If you unpublish a dashboard and then discard changes then the dashboard will be deleted.
More options to delete a dashboard
Other options to delete a dashboard are:
You can delete the dashboard from the navigation bar. Deleting it from the navigation bar will delete it completely, not just from the navigation bar.
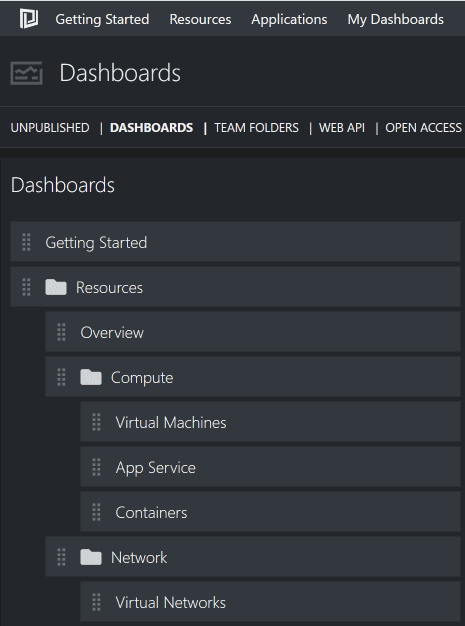
The global navigation editor is accessible only by SquaredUp DS administrators (How to make a user a SquaredUp DS administrator) from the right-hand menu ☰ > edit navigation or system > dashboards.
This allows SquaredUp DS administrators to reposition globally viewable folders and Team Folders on the navigation bar, as well as the ability to move any globally viewable dashboards.
Globally viewable (normal) dashboards are shown simply by the dashboard name.
Globally viewable folders (normal folders that appear on the navigation bars for everyone) are shown by a folder icon:
Team folders are shown with this icon:
Managing the dashboards within Team Folders is done from the Team Folder settings page.
Click on the dashboard 'handle' to drag it to a new position, for example, drag it to the right to move it into a subfolder.
Reordering content is saved automatically and any changes are instantly reflected.
There are 3 icons across different elements of the navigation editor when hovering on a folder:
The edit team folder icon is shown next to Team Folders and clicking it will take you to the Team Folder settings page where you can view and sort the dashboards within the Team Folder.
The view folder button takes you to the folder itself to view or edit that folder.
The delete button will delete items. This deletes the dashboard or folder and sub-contents completely, not just from the navigation bar. (Admin users can restore deleted dashboards from the Recycle Bin
If the dashboard is in a folder, you can go to the folder settings , click the edit button, and delete it from the folder. Deleting it from the folder will delete the dashboard, not just from the folder. Admin users can restore dashboards, see Recycle Bin
Graph colors are set to match by label by default, meaning that the same color will apply to an object with the same label across several graphs. See How to enable graph color matching.
Within SquaredUp DS, it decides which timeframe a dashboard uses when a user goes to the dashboard. Tiles set to use the page timeframe (not a fixed, specific timeframe) will use the default page timeframe every time the dashboard or perspective is opened. Users can change the page timeframe temporarily while they are on the dashboard, but their setting will only last until they leave the page. Their setting will only affect their view of the dashboard, not other users' views.
On Open Access dashboards, tiles that use the page timeframe according to their settings always use the default page timeframe.
Settings for the default page timeframe
You can change the default page timeframe for individual dashboards, or globally:
Changing the default page timeframe of a dashboard will affect this individual dashboard and it's Open Access representation.
The global default page timeframe is "last 12 hours". Changing this default setting will affect all dashboards (including Open Access dashboards) that don't have an individual default page timeframe setting.
Note: If you are sharing the dashboard via Open Access, these changes will also affect the Open Access dashboard.
Go to the dashboard you want to change the individual default page timeframe for.
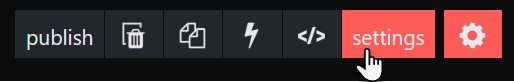
On the dashboard, click the edit button
Click the settings button.
Choose the new default timeframe under Dashboard timeframe.
Click on the publish button to make the changes go live. The dashboard will now by default use the page timeframe you chose. Users can still temporarily change the page timeframe while looking at the dashboard. Tip: If you want to undo the individual page timeframe setting to let the dashboard use the global default timeframe again, you need to switch to the JSON view of the dashboard and delete the parameter that defines the dashboard's page timeframe (for example "timeframe": "last7days").
By default dashboards (and their Open Access versions) refresh every 60 seconds.
This setting allows you to change the refresh interval on a per dashboard basis, both for the normal dashboard and its Open Access version.
This setting overrides the global dashboard refresh interval.
For example, you may need to reduce the load on your external data, or for an API that has an access cost.
You can increase the refresh interval in increments, up to 6 hours. You can also decrease the interval down to 30 seconds on any given dashboard if you need to see the data refreshed more often.
If you're looking for general information about what kind of timeframes can affect a tile please read Timeframes for tiles.
The page timeframe is the timeframe setting a dashboard is currently using. These timeframes are all relative to the current time, for example 7 days ago until now. When a user changes the page timeframe, all tiles that have use page timeframe set will adapt to the new timeframe. (Tiles that do not have use page timeframe set (i.e. are set to specific timeframe or custom timeframe) are not affected and won't change.)
The custom option can be used to set timeframes using ISO 8601 format
SquaredUp DS does not support the week notation.
Default page timeframe
The default page timeframe affects two areas:
Within SquaredUp DS, it decides which timeframe a dashboard uses when a user goes to the dashboard. Tiles set to use the page timeframe (not a fixed, specific timeframe) will use the default page timeframe every time the dashboard or perspective is opened. Users can change the page timeframe temporarily while they are on the dashboard, but their setting will only last until they leave the page. Their setting will only affect their view of the dashboard, not other users' views.
On Open Access dashboards, tiles that use the page timeframe according to their settings always use the default page timeframe.
Settings for the default page timeframe
You can change the default page timeframe for individual dashboards, or globally:
Changing the default page timeframe of a dashboard will affect this individual dashboard and it's Open Access representation.
The global default page timeframe is "last 12 hours". Changing this default setting will affect all dashboards (including Open Access dashboards) that don't have an individual default page timeframe setting.
Note: If you are sharing the dashboard via Open Access, these changes will also affect the Open Access dashboard.
Go to the dashboard you want to change the individual default page timeframe for.
On the dashboard, click the edit button
Click the settings button.
Choose the new default timeframe under Dashboard timeframe.
Click on the publish button to make the changes go live. The dashboard will now by default use the page timeframe you chose. Users can still temporarily change the page timeframe while looking at the dashboard. Tip: If you want to undo the individual page timeframe setting to let the dashboard use the global default timeframe again, you need to switch to the JSON view of the dashboard and delete the parameter that defines the dashboard's page timeframe (for example "timeframe": "last7days").
Note: This setting affects all dashboards (including Open Access dashboards).
On the SquaredUp server, run Notepad as administrator (Start, Run, type notepad, and then right-click and select Run as administrator).
In your SquaredUp DS folder, go to \User\Configuration and find the extensionpacks.json file.
Name of the SquaredUp folder
The default name of the SquaredUp folder is SquaredUp for v6 and above.
For v5 it is SquaredUpv5.
Location of the SquaredUp folder
If you deployed SquaredUp DS via the Azure or AWS Marketplace:
The default location for the SquaredUp folder is F:\SquaredUpv[Version Number]. For v5 it is F:\SquaredUpv5.
If you installed SquaredUp DS using the installer:
A custom location may have been chosen during the installation.
The default location for the SquaredUp folder is C:\inetpub\wwwroot\SquaredUp
For v5 it is C:\inetpub\wwwroot\SquaredUpv5.
Open the extensionpacks.json file and add the property default-timeframe with the value for your new default page timeframe for all your dashboards and perspectives. Example for a default timeframe of 24 hours:
{
"default-timeframe": "last24hours"}
Possible values for the default-timeframe property:
SquaredUp DS allows you to export the data shown on a dashboard to an Excel spreadsheet, using the Export to Excel button shown at the top right of the screen:
Each tile is exported to a separate tab within the file which is saved to the user's downloads folder.
The Set Home Dashboard button at the top of each dashboard allows you to set that dashboard as your personal home dashboard. A panel opens which allows you to Set Home, if no homepage is set, Clear Home if this dashboard is already set as the homepage, or Replace Home if another dashboard is already set as the homepage. The home dashboard will then be shown first when you log in or click the SquaredUp logo. This replaces the default home dashboard, which is the first dashboard on the navigation bar.
If a personal home dashboard is already set, you will have the option to replace it.
In System > Personalization you can see which dashboard is set as your personal home dashboard. Clicking Clear Home will revert you to using the default home dashboard.


 The edit team folder icon is shown next to Team Folders and clicking it will take you to the Team Folder settings page where you can view and sort the dashboards within the Team Folder.
 The view folder button takes you to the folder itself to view or edit that folder.
 The delete button will delete items. This deletes the dashboard or folder and sub-contents completely, not just from the navigation bar. (Admin users can restore deleted dashboards from the Recycle Bin