How to enable graph color matching
What is graph color matching?
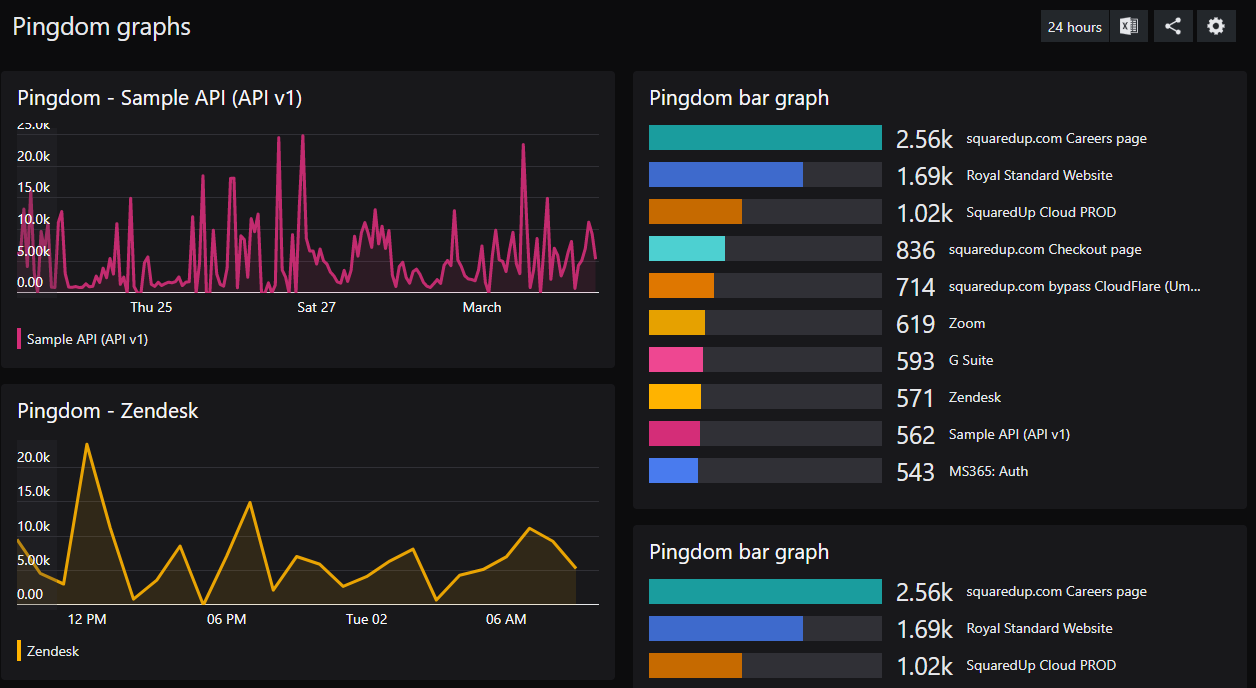
Graph color matching means that one item (a specific resource, object, site, anything you are displaying in your graphs) is shown in the same color in different graphs on one dashboard.
Line Graphs, Sparklines and Bar Graphs support graph color matching.
Color matching only works when the item uses the exact same label in all graphs.
If you turn color matching on, one item (a specific resource, object, site, anything you are displaying in your graphs) is shown in the same color in different graphs on one dashboard. You can use either color matching or custom colors (colors based on values), they cannot both be used at the same time.
How to enable graph color matching
- Graph color matching must be enabled for the dashboard. The default setting for all dashboards is color matching enabled.
The default setting for graph color matching is on. Here's how you can check or change this setting:
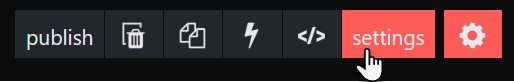
- On a dashboard or perspective click the edit button

- Click the settings button.
- The match by label button is under Graph colors.
If you want to disable color matching, toggle the match by label button to OFF.
If you want to enable color matching, toggle the match by label button to ON.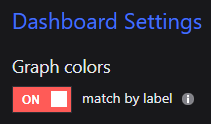
- On a dashboard or perspective click the edit button
- The label for the item must be the same in all graphs that you want to display the same color.
- In the label panel of your graph, set the label to custom label.
- If you are using a mustache property, make sure that you use the same property in all graphs you want to color match.
If you are using a manipulated mustache label (for example, custom text between labels likeName: {{properties.name}}), make sure to use the exact same label in all graphs you want to color match.
If you are using custom text, make sure to use the exact same custom text including upper and lower cases. - For resources that show the same label the colors will now match:
- For Sparklines and Bar Graphs you need to switch on multiple colors to enable color matching. Multiple colors is switched off by default, you need to switch it on for each Sparkline and Bar Graph.
- Go to the color panel of the Sparkline or Bar Graph.
- Toggle multiple colors to on.
The Sparkline or Bar Graph will now color match, as long as the dashboard setting match by label is on and the labels do match.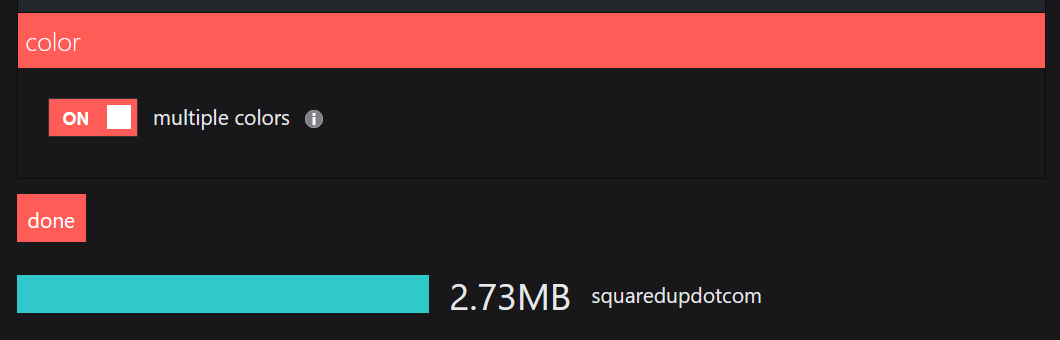
How to enable or disable color matching for a dashboard or a perspective
The default setting for graph color matching is on. Here's how you can check or change this setting:
- On a dashboard or perspective click the edit button
- Click the settings button.
- The match by label button is under Graph colors.
If you want to disable color matching, toggle the match by label button to OFF.
If you want to enable color matching, toggle the match by label button to ON.
How to edit labels to ensure color matching
To ensure color matching works correctly, make sure that the labels for the data on different graphs match. By default (with the auto label setting) they usually don't match, and you'll need to set a custom label in the label section for some of the graphs.
- In the label panel of your graph, set the label to custom label.
- If you are using a mustache property, make sure that you use the same property in all graphs you want to color match.
If you are using a manipulated mustache label (for example, custom text between labels likeName: {{properties.name}}), make sure to use the exact same label in all graphs you want to color match.
If you are using custom text, make sure to use the exact same custom text including upper and lower cases. - For resources that show the same label the colors will now match:
How to enable color matching for bar graphs
For Bar Graphs multiple colors is switched off by default, and can be switched on in the color section.
- Go to the color panel of the Sparkline or Bar Graph.
- Toggle multiple colors to on.
The Sparkline or Bar Graph will now color match, as long as the dashboard setting match by label is on and the labels do match.